Battery Data, The Basics
12 April 2016
Devices powered by batteries are all around us. Think of how many batteries are within arm’s reach as you read this! There are single-use alkaline batteries in our TV remotes and wireless mice/keyboards, and rechargeable lithium batteries in our cell phones and laptops. These devices can be tiny, like pacemakers, or large like the batteries powering electric vehicles or storing energy on the electric grid.
Batteries accumulate electric charge that can be used at a later time. This charge is extracted to produce power from the battery. In the case of rechargeables — or secondary batteries as they’re known in the industry — they can also be charged again and re-used.
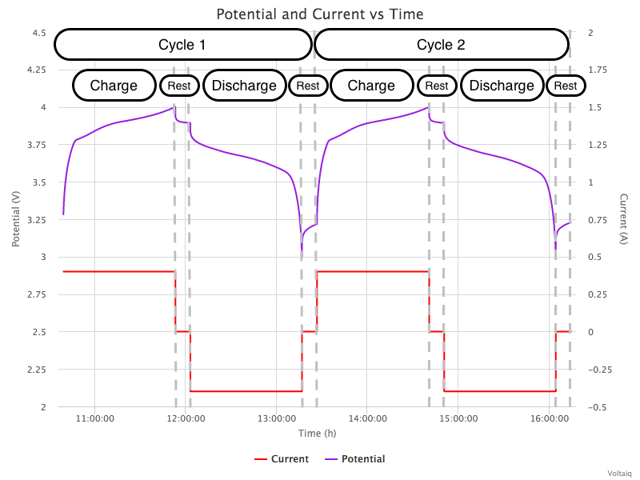
Whether these devices are tested in laboratory or monitored during use, a stream of data is often recorded to describe the battery’s performance. At a minimum this data usually includes the time of the measurement (timestamp), the potential of the battery (in Volts) and the current (in Amps) as the battery is charged and discharged. Higher-order data can also be recorded including a count of the electric charge going into or out of a device (commonly referred to in the industry as “capacity”, measured in Coulombs or Amp-hours) and the same for energy (Joules or Watt-hours), as well as instantaneous power (Watts) and the rate of change for key values such as potential. This first plot shows potential and current vs. time data streams recorded during a laboratory test.

This lab test simulates real world device usage — just as your phone charges up when you plug it in at night, and discharges when you use it the next day. Each time this charge-discharge process repeats, the battery has been run through one cycle. These battery cycling tests can be conducted on equipment from a variety of vendors including: Arbin Instruments, Maccor, Digatron, Bitrode, Bio-Logic and Neware among others.
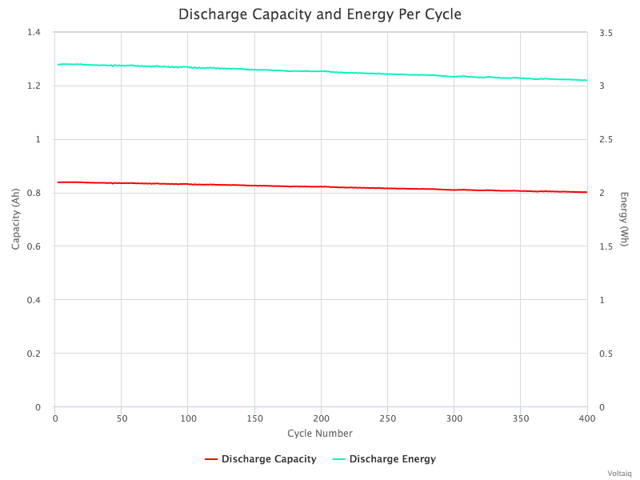
Following each cycle, statistics can be generated that provide insights into the battery’s performance over its lifetime. Key cycle statistics commonly gathered in the industry include a count of the capacity — or electrons — (Coulombs or Amp-hours) and energy (Watt-hours) into and out of a device over a cycle, with charge and discharge usually tracked separately. The plot below shows the capacity and energy extracted from a battery during each discharge cycle. The discharge capacity is a sum of all of the electrons (or Amp-hours) that were released from the battery during that cycle. Discharge energy differs from the capacity measurement in that it incorporates the potential at which those electrons were released.

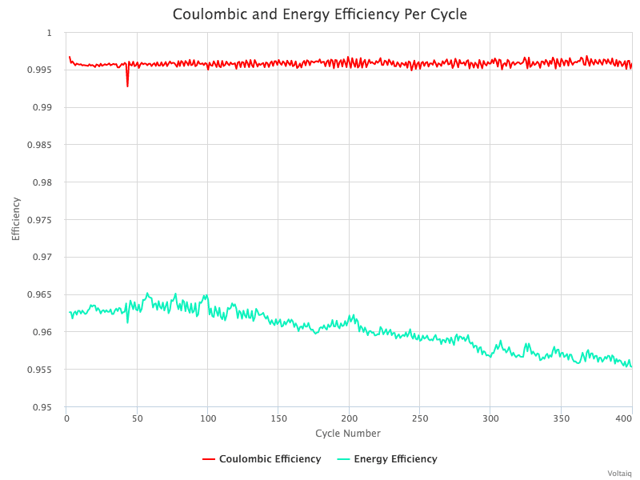
Efficiency is also an important cycle statistic, calculated by dividing what was extracted from the battery (capacity or energy) by what went into it over the course of a cycle. The efficiency of charge going into and out of a battery is known as “Coulombic efficiency” (after the unit Coulomb), while the similar figure for energy is known simply as “energy efficiency”.
Below is a plot of the Coulombic and energy efficiency over each cycle. While the capacity in and out of the battery roughly match, producing a value of nearly 100%, the energy diverges from 100% since the potential at which the battery charges is higher than the potential at which it discharges (see the first plot in this post).

In future posts we’ll dig in deeper into more advanced per cycle statistics and into other hidden features you can find in time series data.
Tutorial on how to search for data in Voltaiq
Tutorial on how to plot data in Voltaiq (coming soon)
