Electrochemistry Data Hidden In Your Time Series Data: dQ/dV
14 April 2016
In our last post we reviewed the basics of battery data (link). Here we’ll start to delve deeper into the valuable insight hidden in raw time-series data — vital information that usually gets overlooked. The first approach we’ll look at is differential capacity analysis (dQ/dV).
While there’s some exciting work being done in academia on differential capacity analysis — check out Prof. Jeff Dahn’s work, and Dr. Matthieu Dubarry's work — this technique is rarely used in industry due to the difficulty of efficiently extracting these advanced parameters from raw data,
Differential capacity (dQ/dV) analysis allows you to observe what is happening in a battery (including degradation, failure mechanisms, changes in chemistry) in much greater detail than can be observed using aggregate statistics like capacity, energy and efficiency per cycle. Conceptually, dQ/dV describes the incremental capacity going into our out of a device over a given voltage increment (some also prefer to use the inverse, differential voltage, dV/dQ). Differential capacity can be derived from raw time series current and voltage data , or accessed directly using a Battery Intelligence platform such as Voltaiq.
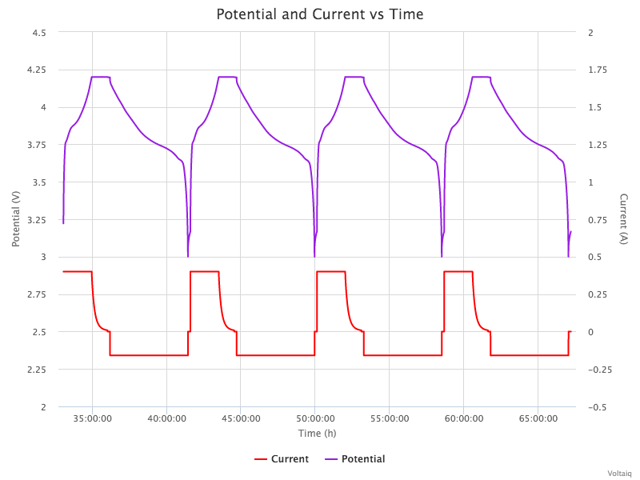
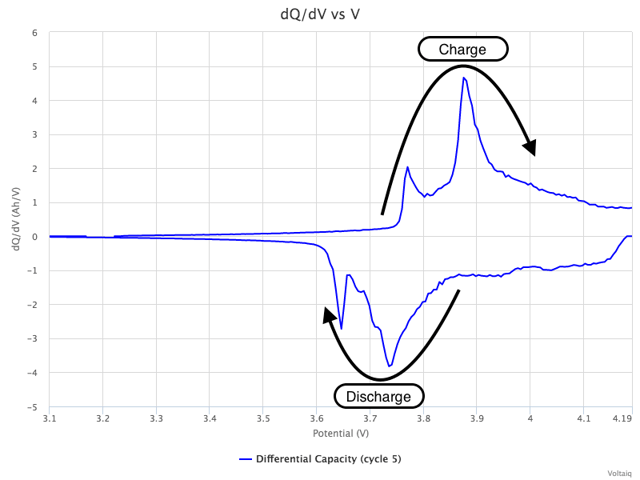
This next plot shows "raw" time series current and potential data, followed by a differential capacity visualization (dQ/dV vs. V) derived from this raw data.


The differential capacity plot displays dQ/dV on the vertical axis, plotted against potential on the horizontal axis, with the loop in this plot showing one charge-discharge cycle. The loop runs clockwise, where the top half of the curve corresponds to capacity going into the battery while charging, and the bottom curve represents capacity leaving the battery while discharging. The peaks in these curves indicate the potentials at which the majority of charge enters or leaves the battery.
The potentials at which these reactions occur tell you which materials are in each of the battery electrodes, and let you observe in detail the differences between different batteries. This type of information would typically only be available through an advanced electrochemical analysis techniques such as cyclic voltammetry, or potentiostatic intermittent titration technique (PITT).
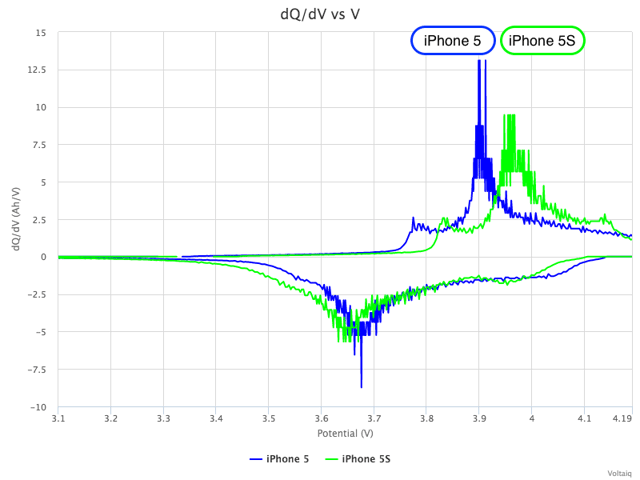
This next plot shows differential capacity curves for batteries from two generations of Apple’s iPhone — the iPhone 5 and iPhone 5s (actually the equivalent aftermarket replacement batteries, purchased from iFixit). The different locations of the peaks between the two curves indicate that the chemistry (and/or electrode balancing) was changed between the two battery generations — the potential at which charge is going in and out of each device is clearly different.

Differential capacity analysis can also be used to track how a battery is changing over time. As a battery ages, features in the corresponding differential capacity curves change in position, height and shape. These changes correspond directly to physical and chemical changes taking place inside the battery. This next pair of plots illustrates how differential capacity can provide this insight.


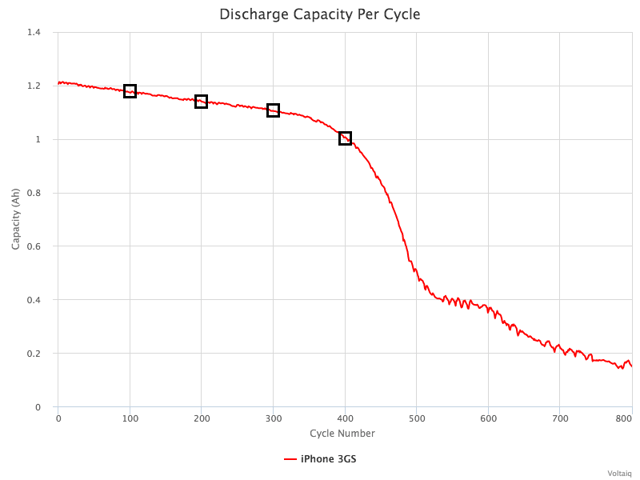
The first plot shows discharge capacity per cycle for an (aftermarket) iPhone 3GS battery plotted over its lifetime. Even though the battery is initially operating well, there is a knee in the curve around 400 cycles, after which it begins degrading rapidly — leaving you stranded with a dead battery every day by noon!
The second plot shows differential capacity curves from cycles 100, 200, 300, and 400 for the same battery (automatically extracted from raw data by Voltaiq). As the battery ages, we can see changes in the height (on the vertical axis) and position (on the horizontal axis) of peaks over both charge and discharge. Notice that the horizontal distance between the peaks during charge and discharge increases as the battery ages (the peak during charge moves to the right, while the peak during discahrge moves to the left). Using Ohm’s law ( V = I * R ), we understand that the shifts in peak position (potential) indicate an increase in resistance over the battery’s life, while the widening and flattening of each peak points to chemical changes to the battery materials. Also notice that at cycle 400 the change in the shape of the peaks seems to be accelerating, even though the battery has only lost about about 16% of its initial capacity (and is thus still reasonably good). This trend suggests that differential capacity can be studied to provide an in-depth model of how a battery ages over time, and can be used to better predict battery failure.
And all of this from plain old cycling data!

