Introducing the Lab Management Dashboard
08 September 2019
The battery industry is growing more rapidly than ever, with dramatic growth in applications such as transportation and consumer electronics driving up demand for extensive battery testing and qualification. Battery product developers are under more pressure than ever to maximize productivity and throughput, with ever tighter resource constraints.
 The sheer scale of these testing demands bring a number of challenges—challenges Voltaiq customers know very well. Once your test operation grows beyond a few dozen channels in a single lab, these challenges start to compound. In talking to a number of Voltaiq customers over the last few years, several common themes and pain points have emerged. To wit, have you ever asked yourself any of the following?
- I have dozens of tests that I need to get started ASAP—where do I have open channels?
- Are the month-long tests I just started still running? Or did they end unexpectedly after just a few hours?
- What is my overall test channel utilization? Am I getting the maximum throughput out of my equipment?
- My organization has multiple test labs. Is each one the right size? Are any of my labs bottlenecked and in need of more channels?
- Where can I get a quick snapshot overview of everything that’s on test right now?
In thinking about how to solve these problems for our customers, we realized that all of the information needed to answer these questions was already in Voltaiq, and was being updated every few minutes. And thus the Voltaiq Lab Management Dashboard was born!
Key benefits of the Lab Management Dashboard
The Lab Management Dashboard was developed with two key goals in mind:
- Maximize testing throughput and equipment utilization across your entire test operation.
- Help to quickly identify and troubleshoot any issues that arise at the channel-, tester-, or even lab-level.
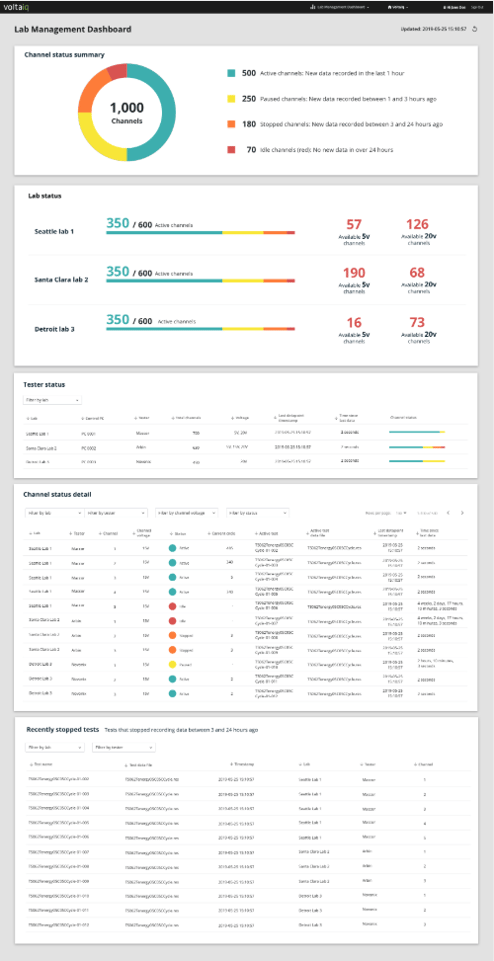
This new product provides a single, unified view of all battery tests currently running across your entire test operation, including tests or channels that haven’t recorded new data for several hours/days/weeks. Status information is aggregated at multiple levels, enabling both a high-level overview of testing activity, as well as the ability to quickly dig into the details of individual pieces of test equipment, or even specific test channels. Color-coded tests statuses offer a quick visual indicator as to whether individual channels, pieces of equipment, and labs are fully utilized and operating as expected.
Lab Management Dashboard features
Organization-wide testing status

The top-level view provides a current snapshot status of all test channels operating across your entire organization. Color coded buckets for Active, Paused, Stopped, and Idle test channels offer a quickly-digestible view of how well your entire test operation is running.
Lab status

Each physical lab is represented, with a color-coded view of testing activity and status. Summary statistics present information on how many channels are actively recording data, and how many are available to start new tests right away.
Tester status

The tester status view displays a record for each individual piece of test equipment detailing the number of channels, available channel voltages, recent testing activity on that equipment, and a color-coded bar summarizing the status of all channels on that tester.
To illustrate the troubleshooting ability of the Lab Management Dashboard, consider the case of a tester that for some reason has gone completely offline (and we all know that can happen!). In that case, the color status bar for that piece of equipment would be entirely red, and would stand out at first glance.
Channel detail

This view details the current status of every channel on every piece of test equipment in your organization. Each channel lists information about the hardware, color coded status, current cycle, active test, and detailed information about how recently this channel recorded data. The table can be filtered by lab, tester, channel voltage, and test status.
Recently stopped tests

This view summarizes all tests that have recently stopped recording data. Use this table to quickly check if the tests you’ve been waiting on are finally complete, or alternatively if they have ended prematurely.
See the Lab Management Dashboard in action
We’ll be offering demonstrations of the new Lab Management Dashboard this week at The Battery Show in Novi. Come visit Booth 2304 and have a look!
If you can’t make it to Novi, contact Voltaiq Sales for a demo and more information.
The Lab Management Dashboard will be commercially available in late September.
